
async-profiler
Sampling CPU and HEAP profiler for Java featuring AsyncGetCallTrace + perf_events
About this project
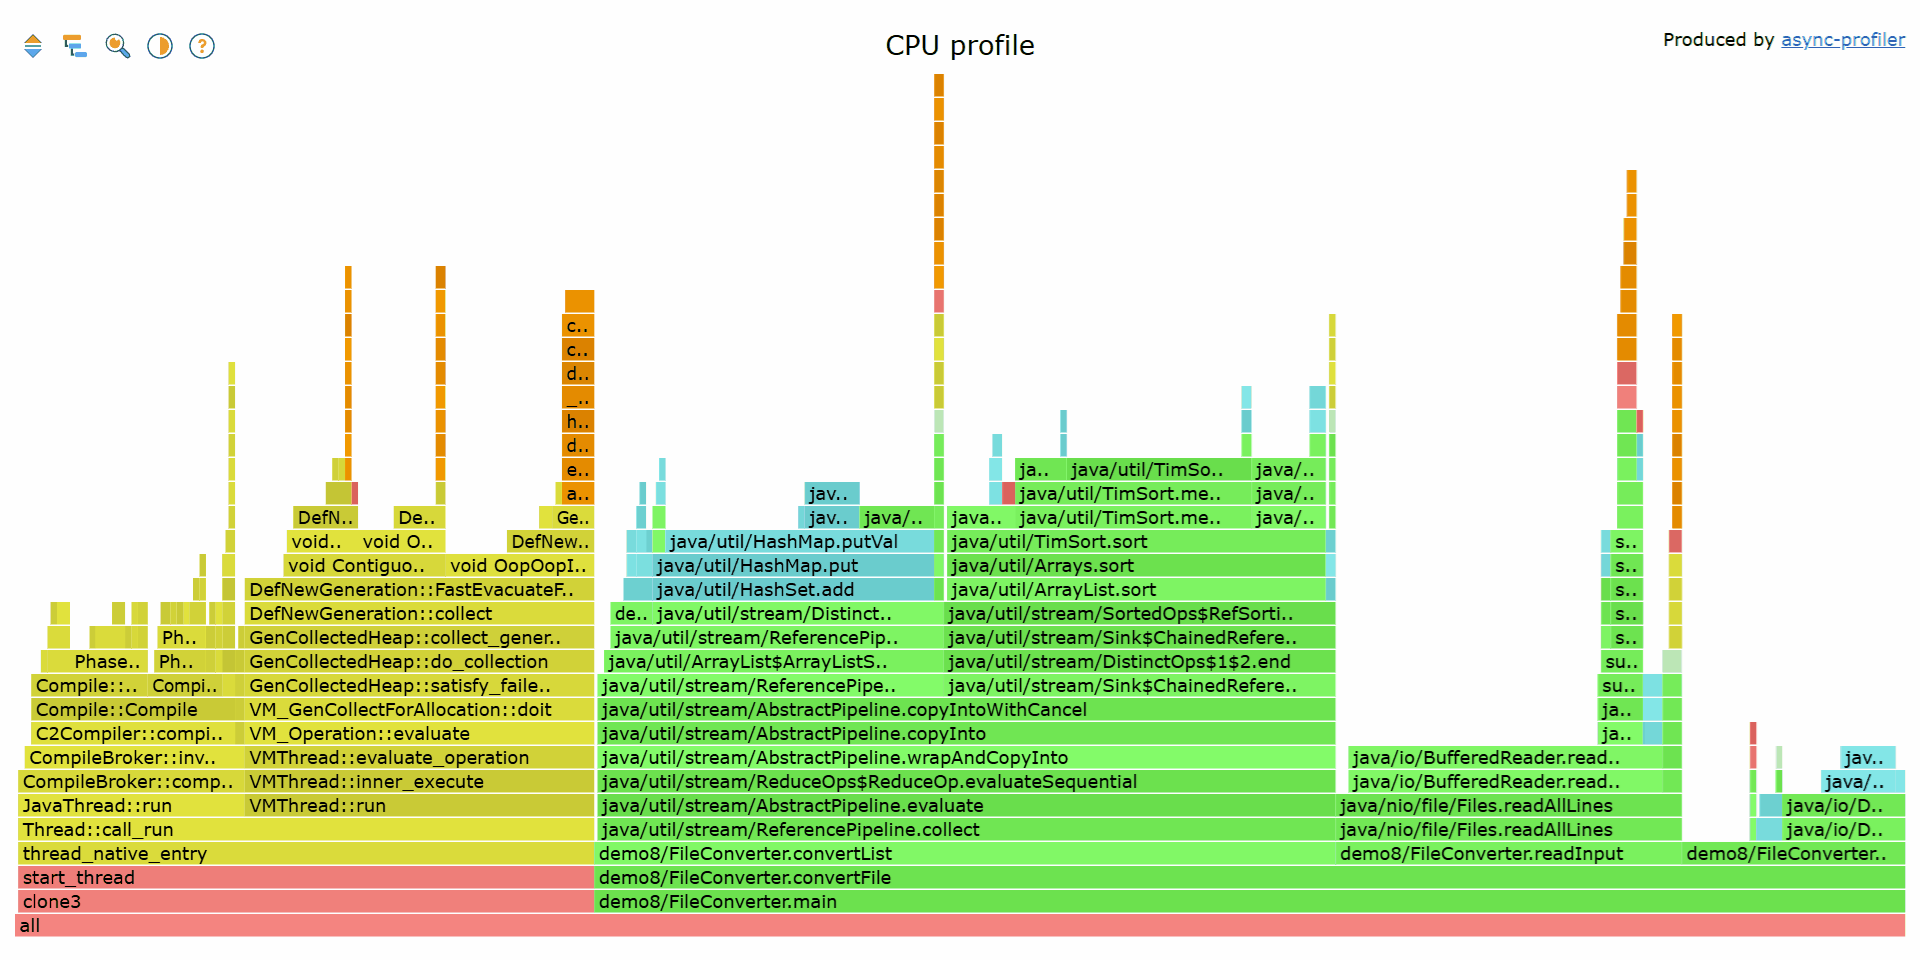
Async-profiler This project is a low overhead sampling profiler for Java that does not suffer from the Safepoint bias problem. It features HotSpot-specific API to collect stack traces and to track memory allocations. The profiler works with OpenJDK and other Java runtimes based on the HotSpot JVM. Unlike traditional Java profilers, async-profiler monitors non-Java threads (e.g., GC and JIT compiler threads) and shows native and kernel frames in stack traces. What can be profiled: — CPU time — Allocations in Java Heap — Native memory allocations and leaks — Contended locks — Hardware and software performance counters like cache misses, page faults, context switches — and more. See our 3…
Technologies
Project health
GitHub
Reviews
Built by
Maintain async-profiler/async-profiler? Claiming verifies admin access through your GitHub account and gives you control of this listing.


