
viztracer
A debugging and profiling tool that can trace and visualize python code execution
About this project
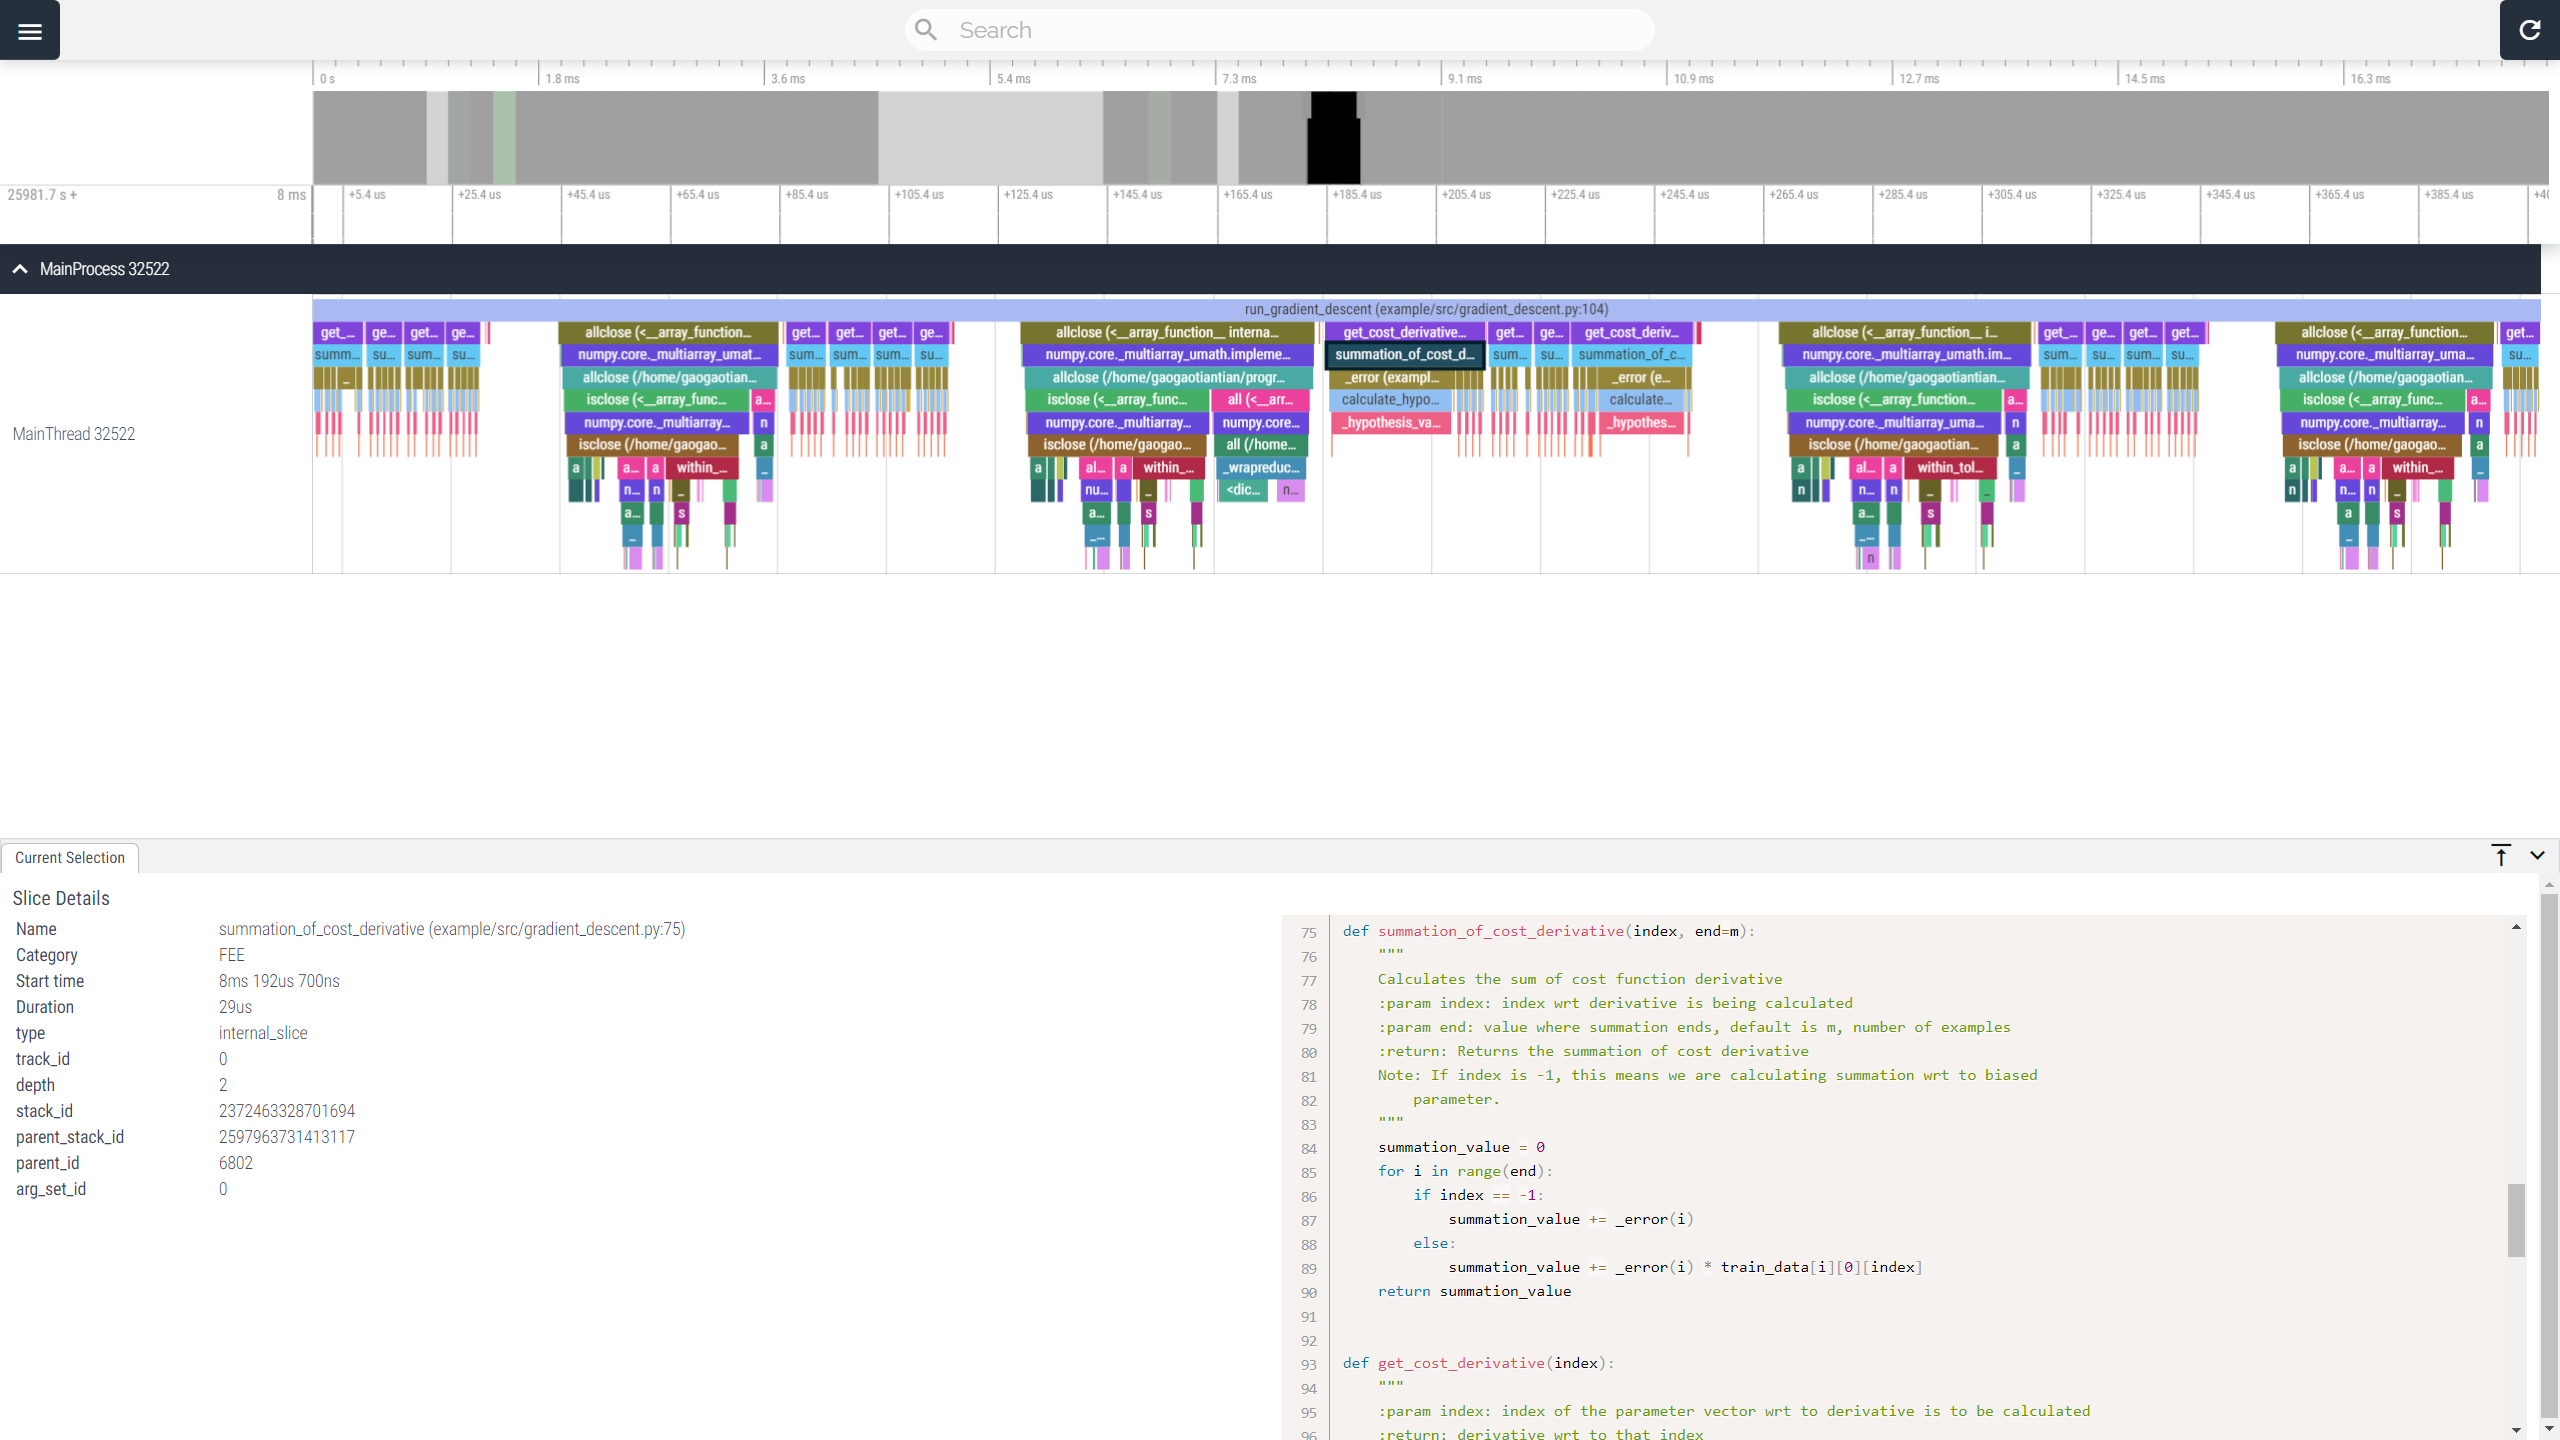
VizTracer VizTracer is a low-overhead logging/debugging/profiling tool that can trace and visualize your python code execution. The front-end UI is powered by Perfetto. Use "AWSD" to zoom/navigate. More help can be found in "Support - Controls". Highlights Detailed function entry/exit information on timeline with source code Super easy to use, no source code change for most features, no package dependency Low overhead, probably the fastest tracer in the market Supports threading, multiprocessing, subprocess, async and PyTorch Powerful front-end, able to render GB-level trace smoothly Works on Linux/MacOS/Windows Install The preferred way to install VizTracer is via pip …
Technologies
Project health
GitHub
Reviews
Built by
Maintain gaogaotiantian/viztracer? Claiming verifies admin access through your GitHub account and gives you control of this listing.


