
uPlot
📈 A small, fast chart for time series, lines, areas, ohlc & bars

About this project
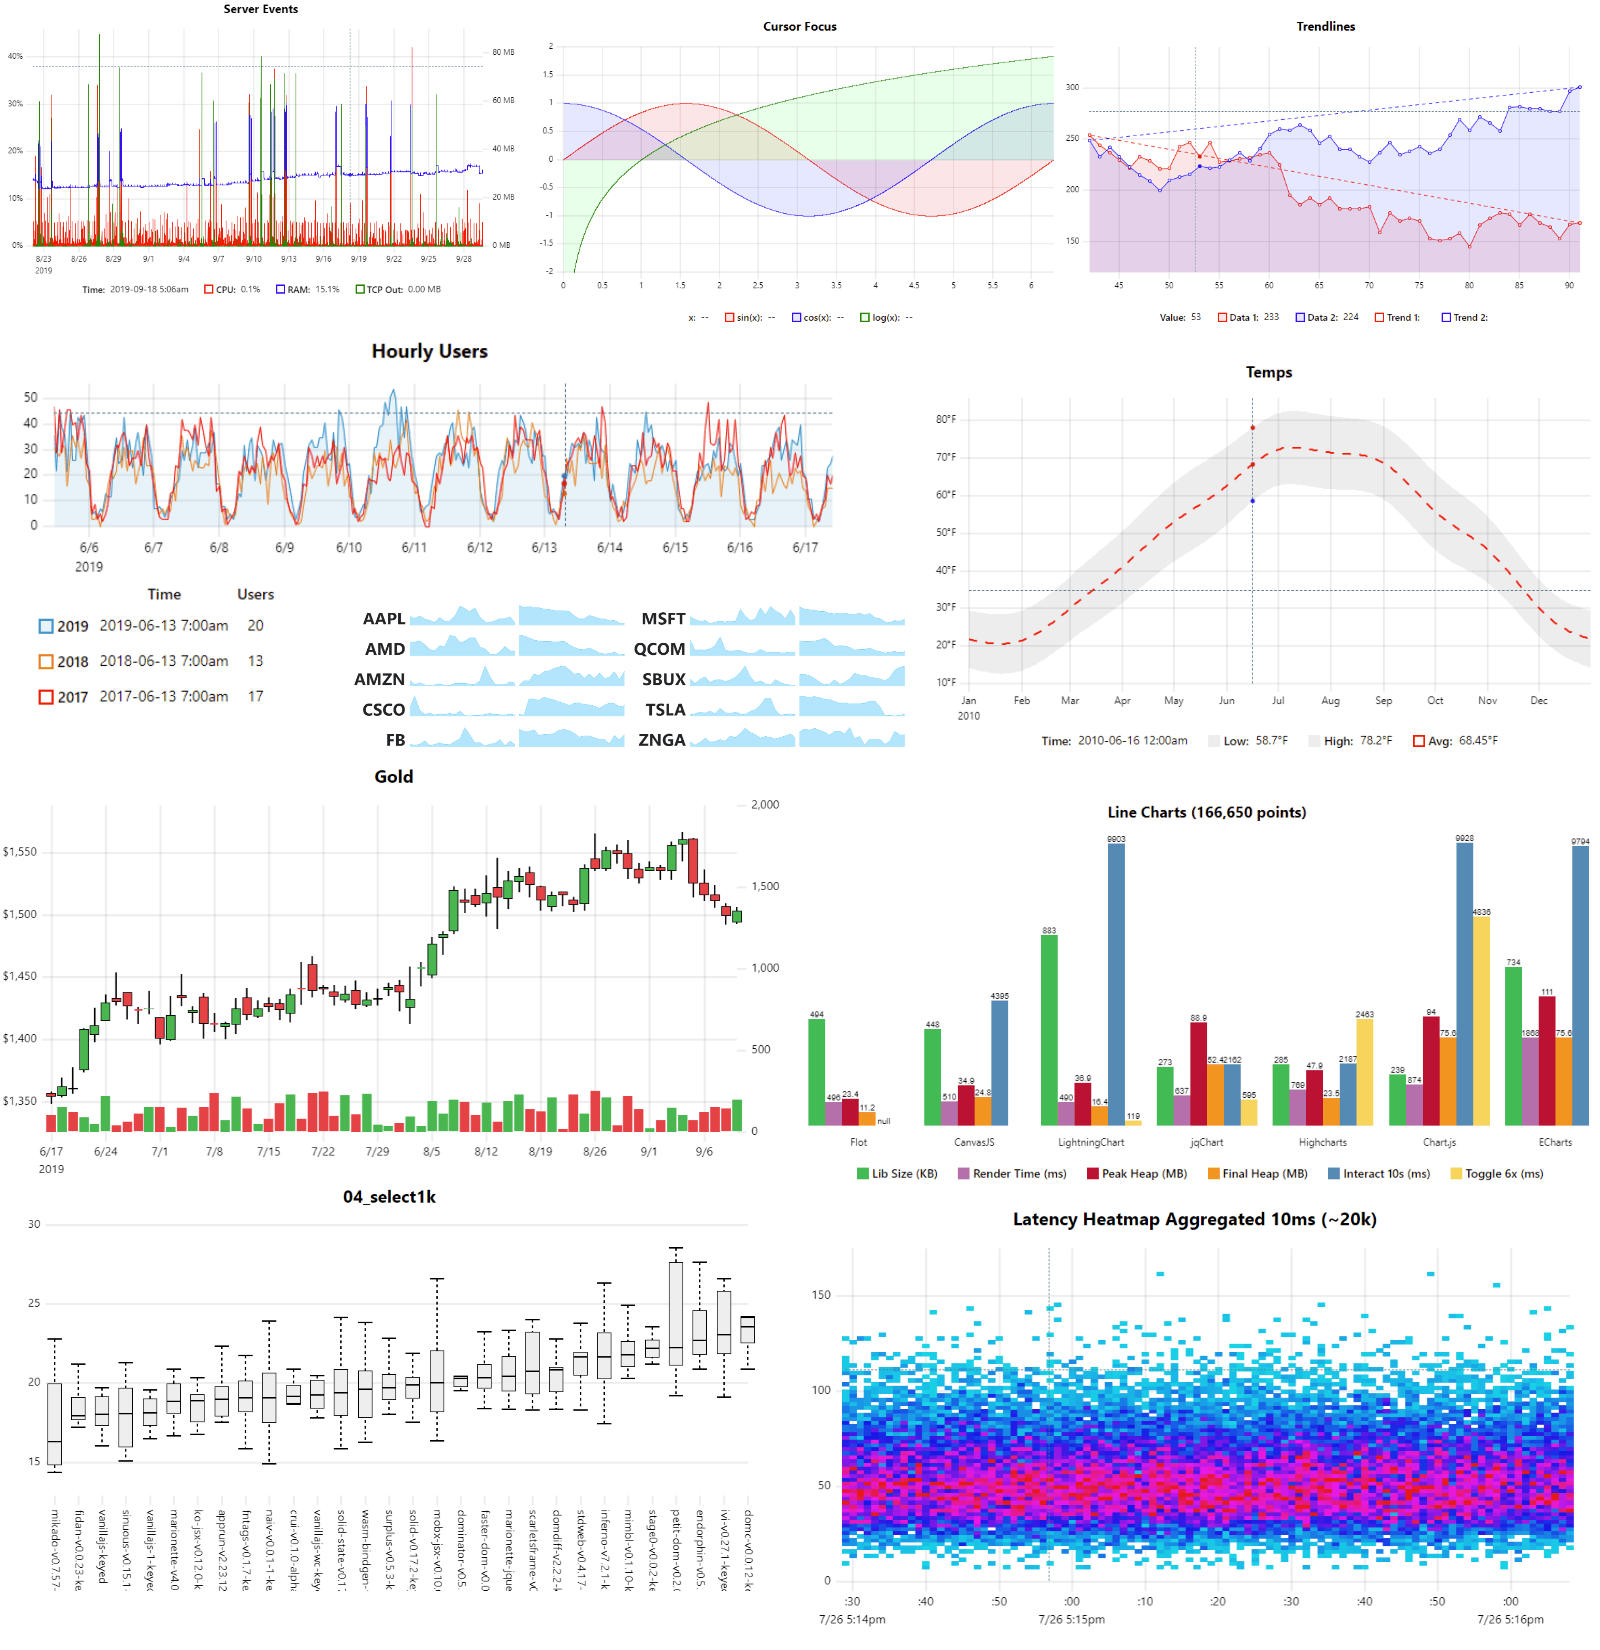
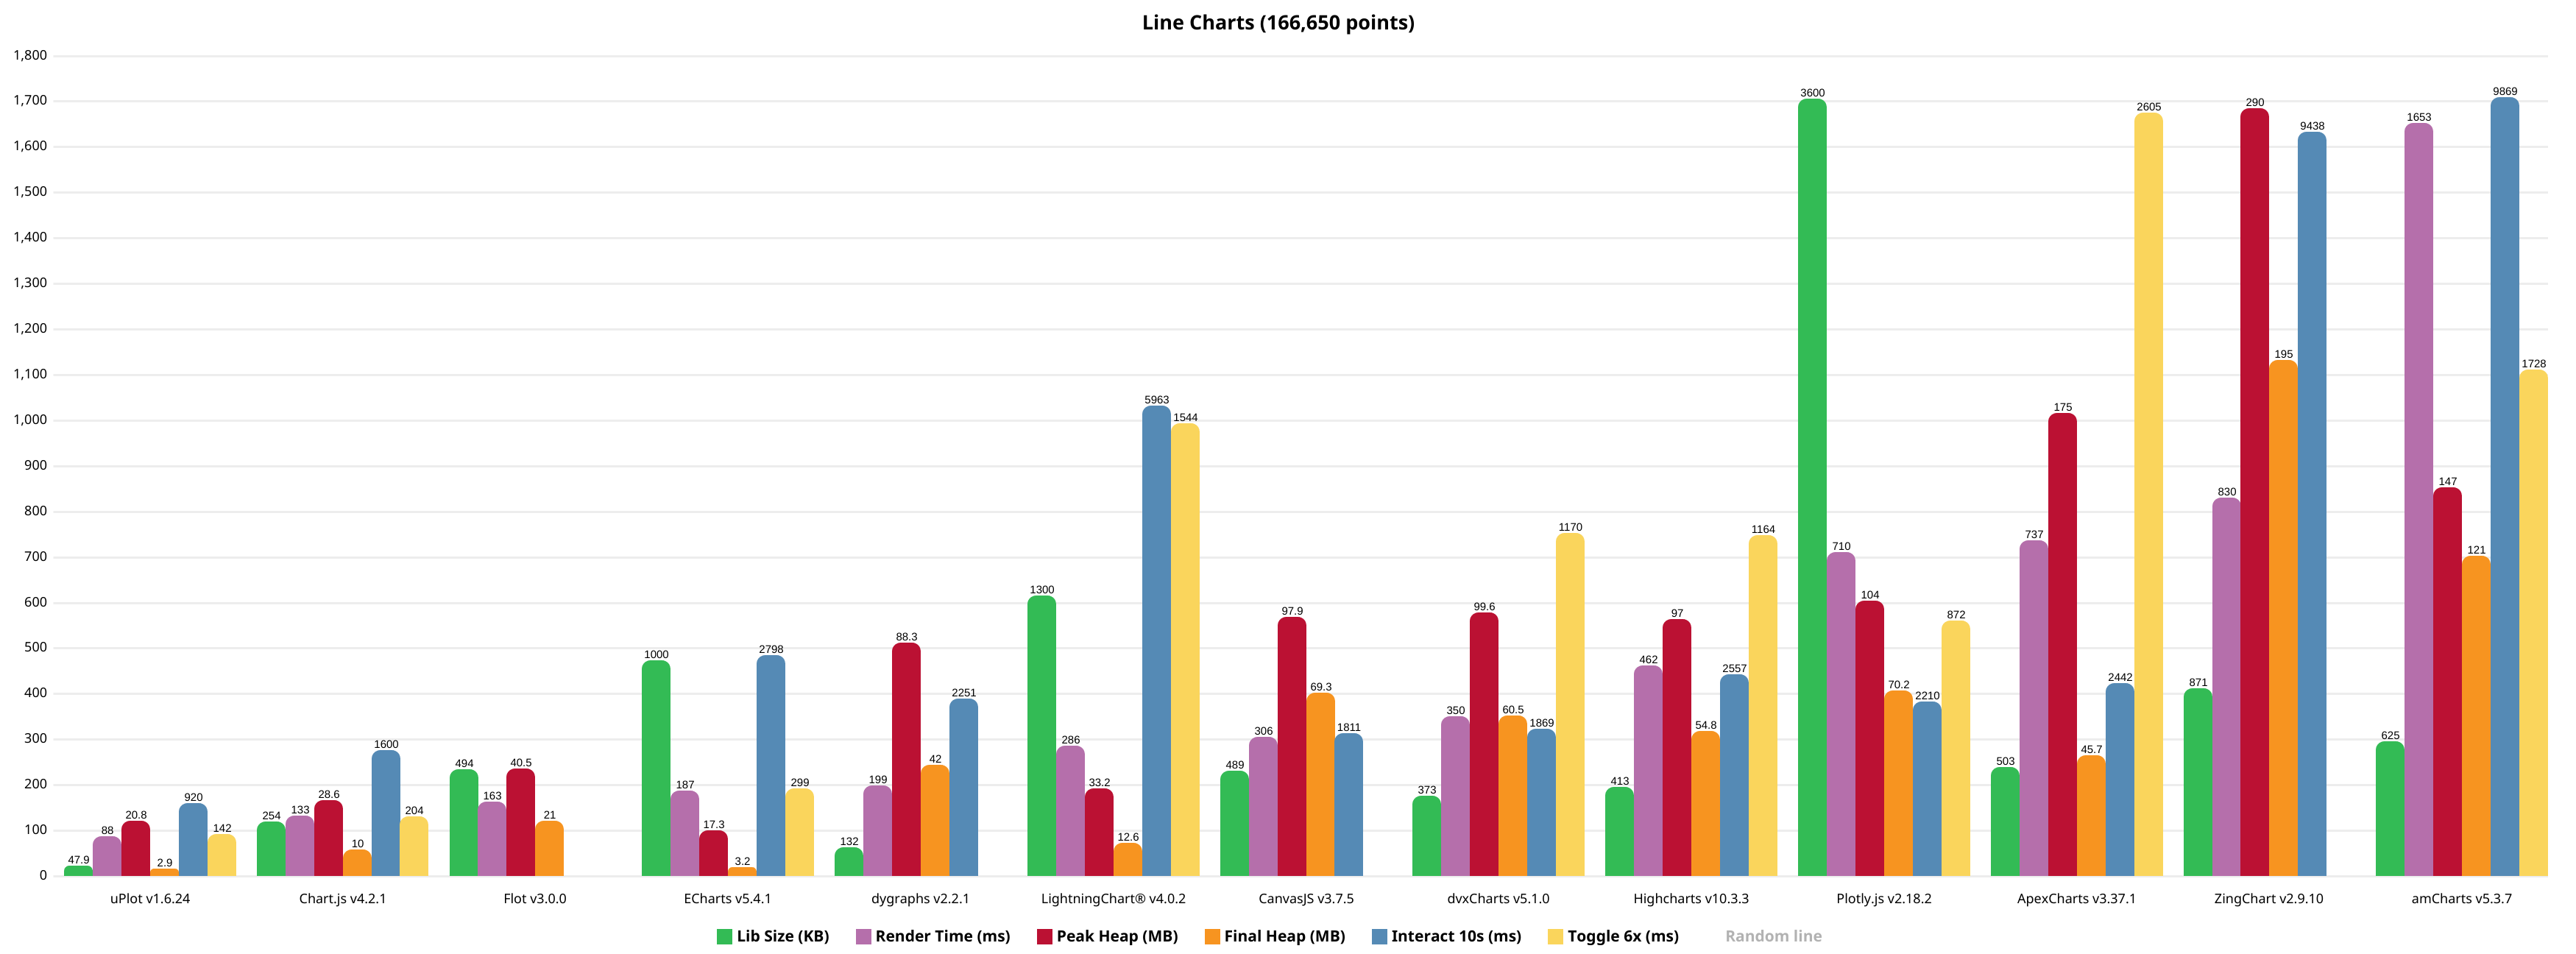
μPlot A small (50 KB min), fast chart for time series, lines, areas, ohlc & bars (MIT Licensed) Introduction uPlot is a fast, memory-efficient Canvas 2D-based chart for plotting time series, lines, areas, ohlc & bars. From a cold start it can create an interactive chart containing 166,650 data points in 25ms, scaling linearly at 100,000 pts/ms afterwards. In addition to fast initial render, the zooming and cursor performance is by far the best of any similar charting lib; at 50 KB, it's likely the smallest and fastest time series plotter that doesn't make use of context-limited WebGL shaders or WASM, both of which have much higher startup cost and code size. In most sane cases, you…
Technologies
Project health
GitHub
Reviews
Built by
Maintain leeoniya/uPlot? Claiming verifies admin access through your GitHub account and gives you control of this listing.


